YAMOUT OPTICAL CENTER
|
YAMOUT OPTICAL CENTER |
|
Product
Optical historical |
Visual Field Testing Our visual world is composed of images of colors, textures, edges and contrasts. In addition, these images may be moving or flickering. The goal of visual testing is to quantify these functions. Traditionally we have tested visual function as visual acuity - the capacity to discriminate the fine details of objects and visual field - the portion of space in which objects are visible at the same moment during steady fixation of gaze in one direction. Color vision testing, flicker sensitivity, contrast sensitivity, pupillary responses and motion testing are some of the other methods of quantifying vision. Visual field testing is a process to determine defects in the field of vision and tests the function of the retina, optic nerve and optic pathways. Threshold Static Automated Perimetry Perimetry is the systematic measurement of visual field function. The most commonly used visual field test today is Threshold Static Automated perimetry. In static (stationary) perimetry, a specific point is chosen for examination and the stimulus is increased until its threshold is determined. The test is performed using automated and computerized machines. Threshold
Static Automated Visual Field With Threshold Static Automated perimetry, a computer program is selected. The most commonly used one tests the central 30° of the visual field using a six degree spaced grid. This is accomplished by keeping the size and location of a target constant and varying the brightness until the dimmest target the patient can see at each of the test locations is found. The visiual field can be thought of as an island of vision. Viewed from directly above, the center of this island may be considered to be the patient's point of central visual fixation. The horizontal and vertical meridians divide the island into quarters. This method of dividing the map into sections provides an additional point of reference for determing locations within the boundaries of the island of vision. Perimetry searches for localized areas within the contours of the visual field island where the eye does not see as well as it should. Such an area of reduced sensitivity is called a scotoma. How Test Is Performed During a visual field test, one eye is temporarily patched. Sometimes the pupils may be dilated. The patient is instructed to look straight ahead at a fixed space and to watch for targets to appear in their field of vision. Because it is also a test of side vision, it is very important that the patient keep looking straight ahead. The eyes must not move to look for the target, but must remain still and wait until a light appears in the periphery of vision. Fixed Targets This test uses small targets that appear bright or dim but do not move. The patient is instructed to sit in a chair facing either a bowl-shaped instrument or a computer screen. The targets appear briefly, so it is a good idea to suggest to the patient that they should try to blink in between each flash of light. The patient is then instructed to respond when the light is seen by pressing an indicator button. The blind spot, which is found in all eyes, is one area however where the test light will not normally be seen. Delays in the appearance of the test light may also occur during the visual field test. Such a delay can be normal and does not necessarily mean the visual field has worsened. Test Procedure and Information Visual field tests are designed to map a person’s visual field; to document the level of peripheral vision. Understanding the various parts of the print-out of the results, such as shown here, is one way of understanding more about visual field testing. Click Button Below A. Test Type Stimulus Size. The visual field analyzer offers five sizes of stimuli which allows for flexibility in testing methods. Unless otherwise instructed, the analyzer will use size III, which is recommended for use with most patients. However, the size may be switched from size III to size IV or V to provide up to one log unit of stimulus range brighter for patients with severely disturbed fields or for research purposes. Background. The visual field analyzer uses the 31.5 apostilb (asb) background illumination that was set as a standard by the International Perimetric Society in 1979. The advantage of this background level is that a patient coming in from a bright room or ordinary outdoor light needs less time to adapt to the background illumination before the test can begin. Perimetry testing should never be performed in a brightly lit room.
B. Patient Info The patient’s visual acuity and age are important factors in obtaining reliable results. The visual field test must be taken with the appropriate correction needed for close vision. Also, since the retina of the normal eye becomes less sensitive with age, it is important that the age of the person being tested be taken into account. When reviewing a visual field test print-out it’s worthwhile for the patient to check to see if these figures are correct.
C. Reliability Parameters The print-out provides three kinds of information to help the doctor assess just how reliably a visual field test reflects the patient’s actual visual field:
1) Fixation losses. It is very important that the patient keep the eye being tested focused straight ahead while taking a visual field test. The doctor wants to know what the peripheral vision is like, that is, vision off to the sides -- up and down, right and left. In practice it is difficult to maintain this eye position for very long, since the natural tendency is to look to the side, towards the flashing light. But because many such movements may make the test unreliable, the machine records how many times the patient moves his eye off center. In this example, there were 3 fixation losses out of 16 fixation checks. (2) False Positives Errors. Sometimes the patient will push the button indicating he has seen a flash when in fact no flash has been shown. This misinformation obviously seriously detracts from the test’s ability to determine what the patient is actually seeing. One reason why the patient may indicate he has seen something even though nothing has been shown is that, like all of us, he wishes to do well on tests. The machine is designed to test for this tendency by making the normal beep or whirr but presenting no light, tempting the patient to click the button inappropriately. Even two false positives may make a test unreliable. (3) False Negative Errors. To further gauge reliability, the test repeats flashes at the same spot at the same and at different levels of intensity. If one time the patient reports seeing a flash at a certain spot, but does not report seeing the same intensity flash at the same spot the second time it is shown, the reliability of the test is reduced. People who have glaucoma may have normal fluctuations at the edge of their visual field loss, so not all of these kinds of errors are truly a problem. (4) Test Duration. A typical 24-2 threshold test takes about 7-10 minutes. A patient with a very disturbed field will take longer. D. Retinal Sensitivity Sometimes a relatively weak flash at a particular spot that could not be seen becomes visible if the intensity of the light is increased. By flashing lights of varying intensity, the machine can ascertain the level of retinal sensitivity at each representative point in the visual field. The numbers on the print-out diagram indicate the level of intensity required to enable the patient to see the flash. The higher the number, the dimmer the light that could be seen.
E. Blind Spot Scotoma A nice picture of a patient’s visual field is obtained by assigning a lighter shade of gray to spots on the visual field in which a patient could see relatively weak flashes (the higher numbers in "D"), and a darker shade of gray to spots in which a patient could see only relatively strong flashes. Here, it is appropriate to point out that all eyes have a blind spot (scotoma) where the optic nerve connects with the retina. It is "blind" because there are no light receptors at this point. The blind spot in the eye shown is indicated by the dark area in the lower left half in this print-out. The exact blind spot location is indicated by a delta sign (small triangle).
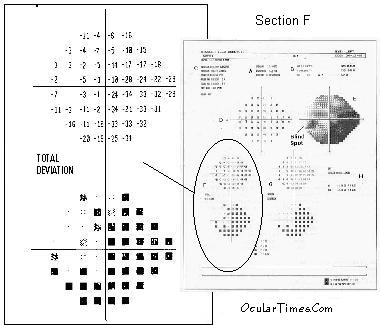
F. Total Deviation As pointed out in B., retinal sensitivity diminishes with age, disease, or other physical factors (i.e. stroke, medications, etc...). The dark boxes in this diagram indicate areas in which the person saw less well than most people his age.
G. Pattern Deviation Many conditions other than glaucoma can cause poor vision, for example, cataract or corneal edema. So, if the doctor wants to know how much of a patient’s relative insensitivity to light is due to glaucoma rather than to something else, it is important to "subtract out" these other factors. This can be done because these others conditions tend to produce a similar pattern of diffuse visual field loss, while glaucoma tends to produce localized areas of visual field loss.
H. Normal Limits These numbers indicate the extent to which the visual field is outside normal limits. They can be followed over time to see the extent to which it is worsening. |
|
|